Run the hours and overtime report
This report answers a question every planner lives with: is each person's year adding up? It tracks, for everyone you plan, how much of their annual working-hours allocation (their man-year) the current plan has committed by a date you choose, how much is still free to plan, and how much overtime has built up along the way. Because it reads from the plan rather than from approved timesheets, it shows you where the schedule is heading while you can still act on it, well before someone runs out of hours in the autumn or quietly accumulates a month of overtime.
What the report covers
A man-year is the annual working-hours norm for a full-time position: the hours one person is expected to work across a year. That norm is set per country, so a Norwegian and a UK crew member are each measured against their own country's figure. Every scheduled day contributes hours toward that annual total, and this report rolls those daily hours up per person.
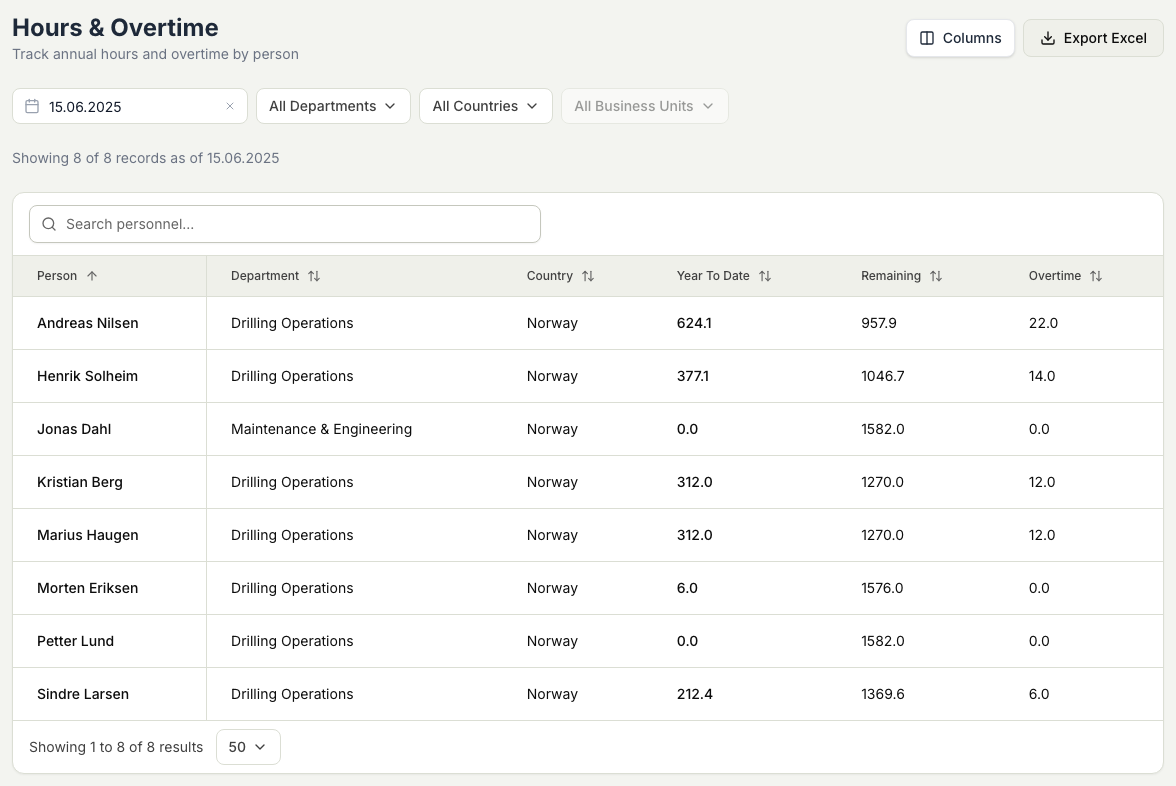
Three numbers carry the report, all counted from the start of the year up to the as-of date you pick:
- Year to date: the planned hours counted toward the person's man-year so far. This is what the schedule has committed them to, not hours approved on a timesheet.
- Remaining: the annual man-year norm minus year to date, showing how many hours of the allocation are still free to plan. It reaches 0 once a person is scheduled up to their full year, so a row sitting near 0 well before year-end is someone you have little room left to plan onto.
- Overtime: the planned overtime accrued to date. Watch it build, because it is both a cost and a rest-and-compliance signal.
Each figure is a calculated value the system derives from the plan, plus any manual adjustment a planner has entered by hand. On screen the two are combined into a single number, shown in blue when a manual adjustment is part of it, with the calculated-versus-manual split in a tooltip. The Excel export breaks them into their own columns (Calculated and Manual for hours, OT Calc and OT Manual for overtime), so a figure can always be traced back to where it came from.
Each person's name links straight to their year plan, so when a number looks off you can open the schedule behind it in one click.
Before you start
- You need the View planning permission to open, read, and export the report.
- These are planned hours from the schedule. For hours actually worked and approved, use Timekeeper instead.
Steps
- In Planner, open Reports, then Hours & Overtime. The table loads as of today.
- Set the as-of date. Every row totals that person's planned hours from the start of the year up to this date.
- Narrow the list with the Department, Country, and Business Unit filters, or find one person with the search box (name or ID).
- Read across each row (year to date, remaining, and overtime) to compare people at a glance. Use the column toggle to hide any column you do not need.
- Sort by any heading: by Overtime to bring the heaviest to the top, or by Remaining to surface who has the least room left to plan. Use the controls at the bottom to change rows per page and step through pages.
- The line above the table confirms the as-of date and how many people are shown.
- To share the report, choose Export Excel, check the preview, and download. The file carries the calculated-and-manual breakdown of every figure.